Results
There are three ways of viewing results. The traditional score view is the default, but all three may be selected via the navigation buttons at the top of the page.
- Score view
- The sequences matched are listed in order of decreasing score
- Taxonomy view
- The matched sequences are arranged according to the taxonomic lineage of the source organism(s)
- Domain view
- Significant matches are grouped by Pfam domains and presented in order of decreasing architecture frequency
Score view
Sequence Matches
Searches can result in many thousands of matches. Returning large numbers of results across the web and rendering them as a table is very time and memory consuming. As such, the first 100 matches are returned by default, allowing immediate analysis of the top matches. The remaining results can be viewed by clicking on the pagination links found above and below the table. You can see the range of matches currently selected in the bottom right corner of the table. Rows in the sequence match table that have a yellow background indicate sequences that score above the reporting thresholds, yet below the inclusion or significance thresholds. Therefore all hits, even if they score above the hit significance threshold will be deemed insignificant. Rows that have a red background indicate sequences that score above the significance/inclusion threshold, but where no single match exceeds the domain significance/inclusion thresholds.
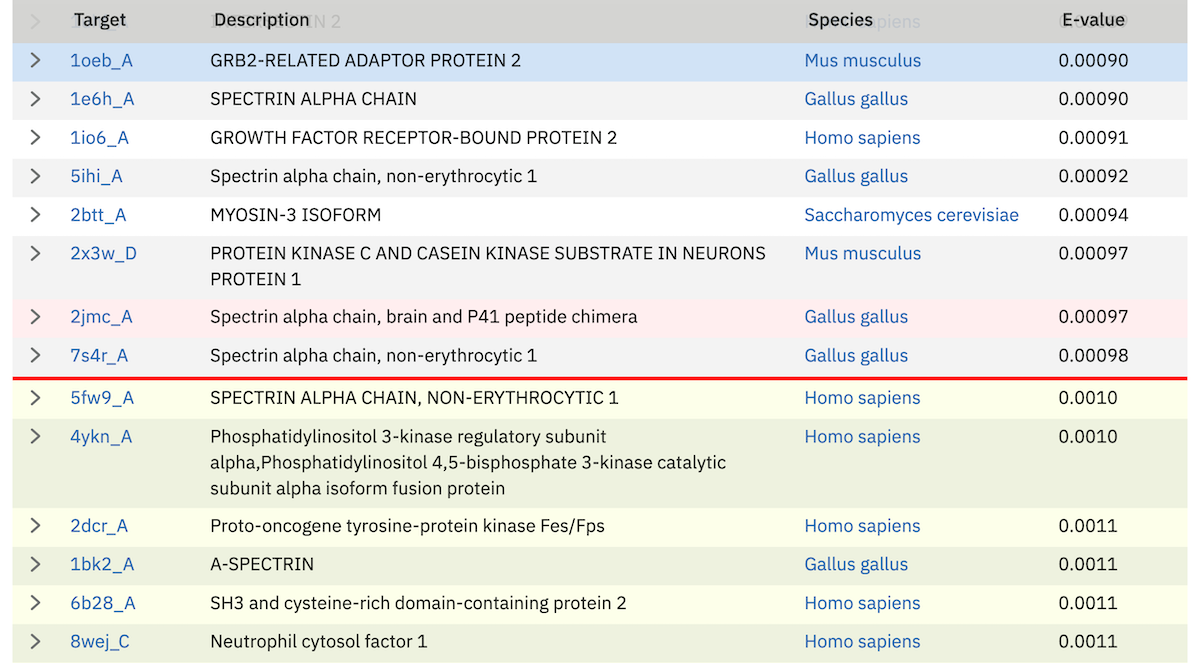
The dark red line in the table provides a visual clue as to where the threshold lies in the results.
Clicking on the right facing arrows (>) in the very first column of the table will reveal the alignment. The show all link in the table footer allows the display of all hit alignments for the sequences shown in the display (this is limited to tables of 100 rows or fewer).
Alignments
At the end of each row in the sequence hit table there is a “show” link. Clicking on this link displays the maximum expected accuracy (MEA) alignment between the query and the target. For each hit between the query and targets there are five rows in the alignment:
- Position line
- (*) occur every 10th column of the alignment.
- Query line
- the most probable sequence from the HMM that is coloured according to the match. In the case of a single sequence search, it is the query sequence.
- Match line
- indicates identical residues (letters) or similar residues (+)
- Target line
- the sequence aligned to the MODEL which is coloured according to the posterior probability.
- PP line
- the per position posterior probability
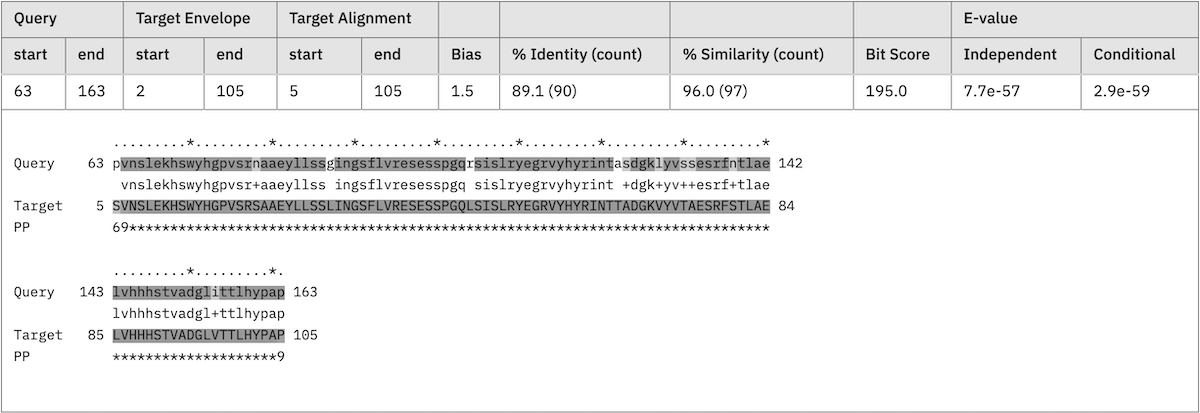
Above the alignment the match details are presented:
- Query start/end
- The start/end of the MEA alignment of this domain/hit with respect to the profile HMM, which directly relates to the query sequence for phmmer. For hmmsearch, the number corresponds to the match states that HMMER determined from the initial input alignment.
- Target Envelope
- the domain envelope on the sequences defines a subsequence for which their is substantial probability mass supporting a homologous domain/hit, whether or not a single discrete alignment can be identified. The envelope may extend beyond the positions of the MEA alignment.
- Target Alignment
- The start/end of the maximum expected accuracy (MEA) alignment of this domain with respect to the target sequence.
- Bias
- The bias composition correction is the bit score difference contributed by the null2 model. High bias scores may be a red flag for a false positive. It is difficult to correct for all possible ways in which nonrandom but nonhomologous biological sequences can appear to be similar, such as short-period tandem repeats, so there are cases where the bias correction is not strong enough (creating false positives).
- Accuracy
- is the mean posterior probability of aligned residues in the maximum expected accuracy alignment, essentially a measure of the reliability of the overall alignment. The accuracy ranges from 0 to 1, with 1.00 indicating a completely reliable alignment according to the model.
- Bit score
- The bit score for this domain.
- % Identity (count)
- The percentage of identical residues between the query and the target. The shortest length of the query or target is taken as the denominator. The number of identical residues is shown in brackets.
- % Similarity (count)
- Similar to percent identity, except the sum of identical and similar residues (denoted by the + in the match state line) is used in the calculation.
There are also two E-values for the domain:
- Conditional E-value
- This is the E-value that the inclusion and reporting significant thresholds that are measured against (if defined as E-values). The conditional E-value is an attempt to measure the statistical significance of each domain, given that it has already been decided that the target sequence is a true homolog. It is the expected number of additional domains or hits that would be found with a domain/hit score this big in the set of sequences reported in the top hits list, if those sequences consisted only of random nonhomologous sequence outside the region that sufficed to define them as homologs.
- Independent E-value
- This is the significance of the sequence in the whole database search, if this were the only domain/hit that had been identified. If this E-value is not good, but the full sequence E-value is good, this is a potential red flag. Weak hits, none of which are good enough on their own, are summing up to lift the sequence up to a high score.
There can be multiple hits per sequence because HMMER performs local-local searches (meaning any subsequence of the query model can align to any subsequence of the target sequence). These are shown sequentially, according to the position on the sequence. An alignment with a yellow background indicates a reported domain/hit that falls below the domain/hit significance threshold.
Note: In the case of hmmscan the query and target lines correspond to different data. The second line (previously query) is the “Model” and the fourth line (previously target) is the “query”.
Jackhmmer iterations
Iteration summary
After each iteration for jackhmmer, rather than proceeding to the results page, you are taken to a summary page, which gives an overview of the number of gained, lost or dropped sequences. Sequences gained are those that are new sequences compared to the previous iterations, scoring above the significance threshold. Lost are previously significant sequences, that are no longer reported in the results. Dropped sequences are sequences that were previously significant, but have fallen below the threshold but are still reported.
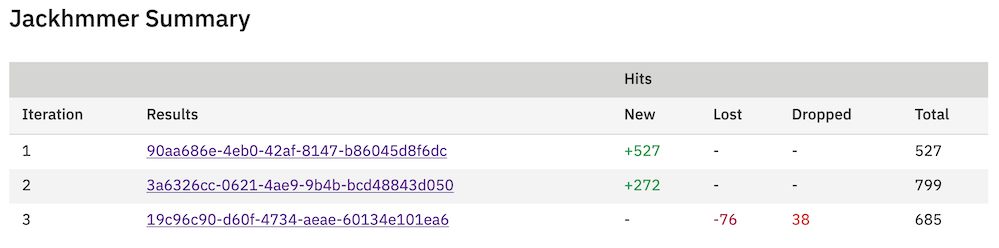
From this table it is possible to view the results of all previous iterations. Thus, if you decide that you want to re-run the latest iteration you can simply go back one and add/remove sequences. Alternatively, if you are happy with the way searches are proceeding, trigger of the next search, with will take all significant hits for the next iteration. If you job converges before 9 iterations (which is the current maximum), the table will be updated to indicate convergence.
Jackhmmer results
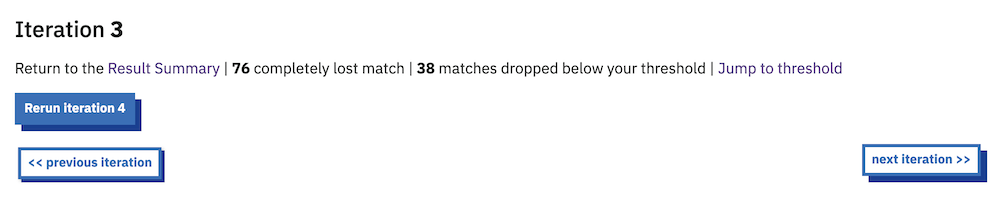
The results for jackhmmer are much the same as described above for phmmer. However, there are a few additions. The first is the inclusions of some navigation at the top of the page. There are links to the first new match and to the page of results where the threshold appears. There are also buttons in this block that allow you to move between iterations.
Another difference is that each row in the results has a check box, which allows sequences to be either removed or added to the results (a checked box denotes that they will be used in the next iteration). This allows you to modify which sequences are included in successive rounds of jackhmmer. By default, all sequences above the significance threshold are included. As a convenience, an option to override this and deselect all sequences is provided. This might useful if you wish to manually add only a small number of sequences. A button at the top and bottom of each page will allow you to start the next iteration.
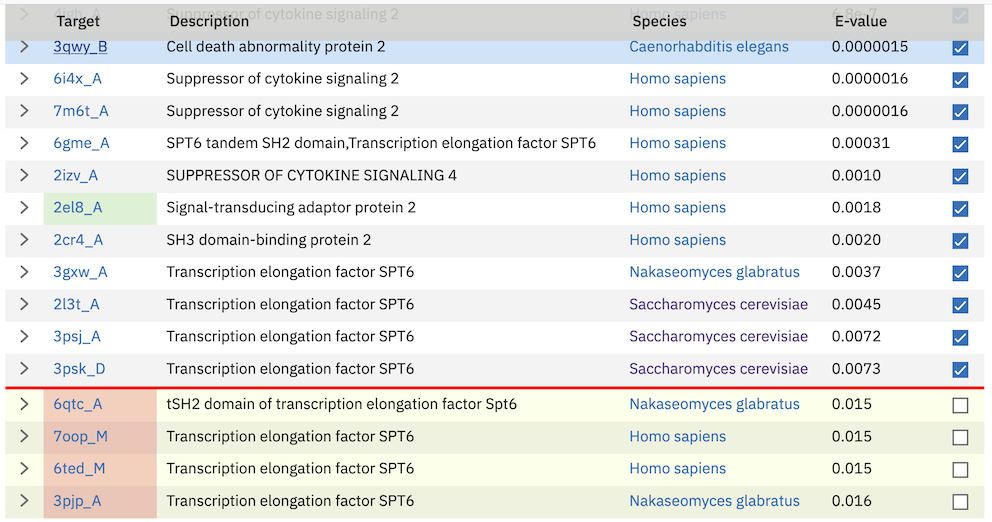
New sequences in the results are denoted with a green background behind the target accession/identifier. Sequences that have dropped below threshold compared to the previous iteration are shown with a red background behind the target accession/identifier.
Customisation of Results
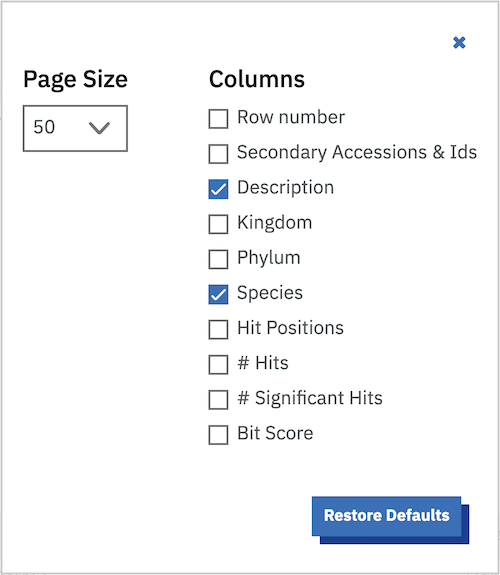
The default sequence match table contains four information columns: Target (accessions and/or identifiers), Description (functional annotations), Species and E-value. Additional columns can be added by clicking on the “Customise” link at the top right of table. This will reveal a form (shown below) that facilitates a range of custom display options.
The columns that can be selected are:
- Row Count
- Number the columns
- Secondary Accessions & Ids
- Additional identifiers that the sequence may also be known as in the literature and other databases
- Description
- The sequence description
- Species
- Shows the species to which this sequence belongs and provides a link to the NCBI taxonomy Browser
- Kingdom
- Shows the kingdom to which this sequence belongs
- Predicted Structures (AlphaFold)
- Shows whether a structure has been predicted by AlphaFold
- Number of Hits
- The number of regions that score above the reporting threshold
- Number of Significant Hits
- The number of regions that score above the inclusion threshold
- Bit Score
- A bit score in HMMER is the log of the ratio of the sequence’s probability according to the profile (the homology hypothesis) to the null model probability (the non-homology hypothesis).
- Hit Positions
- A graphical representation showing the location of the matches of the query sequence to the target. Below is an example of a query sequence (top) that has 2 regions matching 4 regions in the target sequence (bottom). Note that there are 3 hits coloured red. These hits are all the same colour as they are found in an overlapping region of the query sequence. The fourth hit is labeled differently because it does not overlap any of the other sequences. The query and target images are scaled according to each other, so the query may scale differently from row to row in the table.

- Page Size
- In addition to column selection you can also choose the number of rows to be displayed per page. The default value is currently set to 50 rows per page, which shows you a reasonable amount of information, without over loading your browser.
Profile HMM Matches
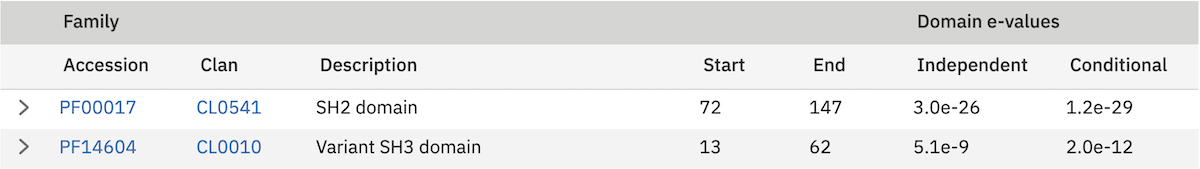
This table differs slightly from the Query Match table above. As one sequence is being compared to a profile HMM database, we just report the domain hits.
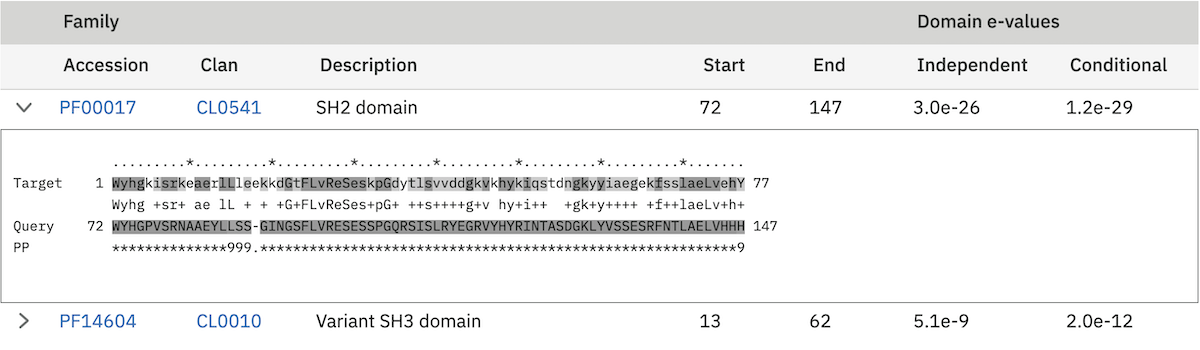
This table is shown automatically for hmmscan searches. This gives the basic list of matches to Pfam domains, including the Pfam identifier, accession, clan accession and short description. The start/end positions in the basic view relate to the domain envelope. Finally, the domain conditional and independent E-values (described above). As before, rows in the match table that have a yellow background indicate matches that score above the reporting thresholds, yet below the inclusion or significance thresholds.
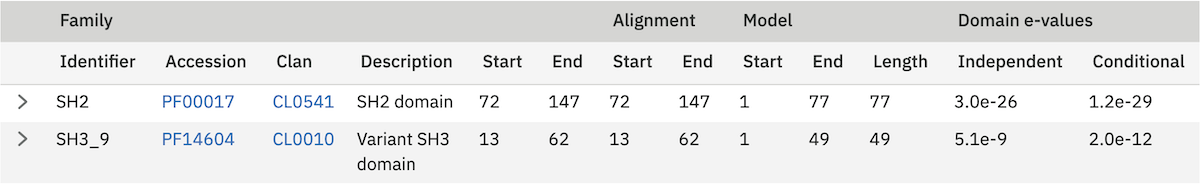
The alignment start/end positions (that indicate the position of maximum alignment accuracy), HMM model length and match start/end positions, as well as the bit score can be obtained by clicking on the advanced option in the top right of the table heading row.
Similar to the sequence hits, the show link reveals the alignment. This produces a similar formated pairwise alignment. Notice, that the query is now in the bottom row as the sequence is compared to a profile, not converted into a profile as with phmmer.
Database specific result fields
Pfam
In Pfam related entries are grouped into Clans, and as such can often match the same, or similar, regions on the query sequence. An additional column in the results table contains the clan accession for the family, if it belongs to a clan. Pfam employs a specific post processing on families from the same clan where the best match (determined by lowest E-value), is taken and the rest are out-competed. In the results, the entry that has won the competition is indicated by a ✔ next to the clan accession and will be rendered in the domain graphic.
Domain Graphic
By default, a search using hmmscan is run when running a phmmer search. This will indicate the presence of any known Pfam domains on your query sequence. As with Pfam, we present the hits graphically as shown below:
In this example, there are two domains on the sequence. The second domain is label SH2, the first domain is an SH3 domain. You can reveal which domain the first representation is by mousing over the graphic or by viewing the table of domain hits. Note that the number of domains in the table and in the graphic may differ due to Pfam Clans, where multiple HMMs are used to represent large, divergent families. We apply the same post processing to remove overlaps as Pfam to produce the graphic, but unlike Pfam, we show all matches in the table.
When the sequence does not match the full length of the HMM that models the entry, matching domain fragments are shown. When a sequence match does not pass through the first position in the HMM, the N-terminal side of the domain graphic is drawn with a jagged edge instead of a curved edge. Similarly, when a sequence match does not pass through the last position of the HMM, the C-terminal side of the domain graphic is drawn with a jagged edge. In some rarer cases, the sequence match may not pass through either of the first or last positions of the HMM, in which case both sides are drawn with jagged edges.
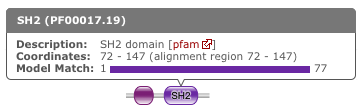
Model Match
The model match section in the domain graphic pop up provides a graphical representation of the location the alignment to the model occurred. A full length match is indicated by the coloured bar spanning the entire length of the graphic. A shorter match will show the coloured bar overlaid onto a thinner grey bar.
Hit Coverage & Similarity
The coverage graph provides an overview of how the ensemble of target sequences matches the query sequence. As a match between a query and target sequence can be to a sub-region on either sequence, the presence of a ubiquitous domain in the query sequence can skew the set of matches to that region. The red line denotes the positional match information, which we term coverage, and is calculated on a per column bases, so gaps on the target sequence are taken into account. The coverage data can provide an indication of conserved regions or domains. We also summarise sequence conservation information that would normally be gleaned from inspecting the multiple sequence alignment, in the same graph. For each position in the query, we determine the relative percentage identity (grey area) and similarity (blue line) of the sequences covering that position. This allows the rapid identification of more conserved positions in query sequence.
Hit Graph
When the target is a sequence database (phmmer or hmmsearch), we produce a graph to show the distribution of matches. This can be found just above the ‘Query Matches’ table. The x-axis is hits that have been binned or grouped by E-value, the y-axis is the number of hits in the bin: An example is shown below:
The columns of the graph link to the table containing the sequence hits. Thus, to view hits with a higher e-value, click on one of the bins closer to the right side of the graph and the table will be scrolled to that position. Furthermore, each bar in the graph is broken down according to the taxonomic kingdom to which the source organism belongs. It is then simple to assess the taxonomic range of sequence matches to the query sequence.
Downloading
The downloads section is accessed by clicking on the Download tab at the top of the page. There are a total of 9 different download formats for the different search algorithms:
| Format | Description | Algorithm | Gzipped | |||
| phmmer | hmmsearch | hmmscan | |||
| FASTA | Single file containing all the regions matched in your hits in FASTA format | ✔ | ✔ | ✔ | |
| Full Length FASTA | As for FASTA, but the full length sequences for significant search hits | ✔ | ✔ | ✔ | |
| Aligned FASTA | Significant search hits returned in the aligned FASTA_ format | ✔ | ✔ | ✔ | |
| STOCKHOLM | Significant search hits returned in STOCKHOLM_ format. Useful if you wish to use your results with the command line version of HMMER | ✔ | ✔ | ✔ | |
| ClustalW | Significant search hits returned in ClustalW format | ✔ | ✔ | ✔ | |
| PSI-BLAST | Significant search hits returned in PSI-BLAST format | ✔ | ✔ | ✔ | |
| PHYLIP | Significant search hits returned in PHYLIP format | ✔ | ✔ | ✔ | |
| Plain text | Designed to be human readable with less information compared to the other formats | ✔ | ✔ | ✔ | |
| HMM | A profile HMM generated from the uploaded multiple sequence alignment. LogoMat-M can be used to generate a graphical representation of the HMM | ✔ | |||
Taxonomy view
Tree Graphic
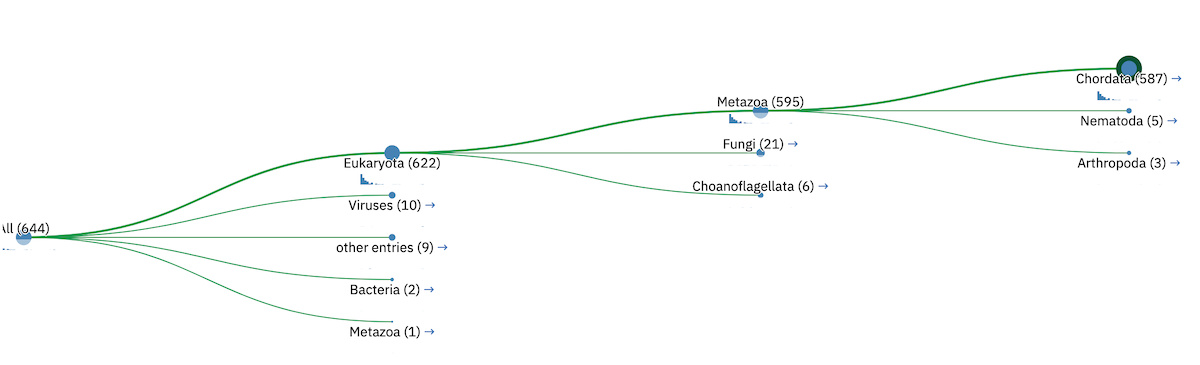
The first item on the Taxonomy view page is the taxonomic tree graphic. This shows all the sequence hits distributed across a tree derived from the NCBI taxonomy database. The tree starts on the left side with “All” sequences and each step to the right divides the data further until the species level is reached. Each node in the tree contains the classification name and the count of all hits from that point down. There is also a small hit distribution graphic located below each node, which indicates the proportion of significant hits found within that taxonomic group. Directly below the tree there is a directory like listing, which indicates all the parent nodes of the currently selected node. Clicking on one of the parents allows you to traverse back up to that level of the tree.
Species Distribution
The “Species Distribution” table is linked to the Tree graphic and displays all the species in which a hit occurred. As you descend down the tree, the number of species listed in the table will be reduced to show only those species that are found within the current top-level node. Along with each name we also show the number of hits that were found against sequences from the species. The last column is a link back to the score page that will provide more details on the hits associated with that species.
Domain Architecture view
The “Domain Architecture” view is designed to group all significant sequence matches based on their constituent Pfam domains. The Pfam domains are defined using the Pfam curated gathering thresholds and can not be altered by search parameters. The results of a search are then displayed with the most frequently occurring architectures first.
Domain Graphic (Query)
This section is only available when running phmmer. An hmmscan is run against the pfam database for the query sequence. Domains found on that sequence are represented graphically as shown by the example below. This graphic is exactly the same as the one that can be found on the score view page, if the hmmscan was run as part of the original query. If not, a hmmscan is run using the default Pfam gathering thresholds. This allows the query sequence domain architecture to be compared to those found on the matched target sequences. Below this graphic, there is a link that will will take the users to the same architecutre as the query sequence architecture, if found in the set of target sequences.
Domain Architecture list
The domain architecture list is a breakdown of all the sequences found by your search according to the Pfam domains found within each sequence. Sequences with identical domain architectures are grouped together and ordered by the most frequently occurring. Note, sequences with no domains on them is also considered as an architecture. Each architecture group is represented on the page by a row in the table and each row can be divided into four subsections. An example is shown below:
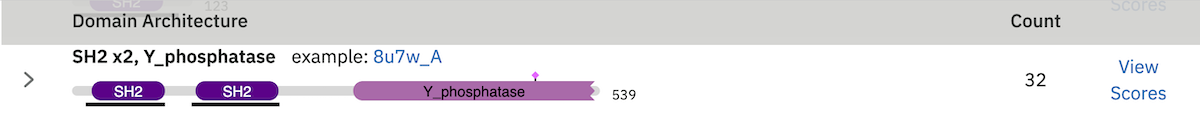
Row Subsections
- Sequence Count
- This is the number of sequences that share the domain architecture. Clicking on this count will reveal the domain architecture graphics for all of the sequences in this group. If there are more than 40 sequences with the same architecture, the results are paginated in sets of 40. The “Show More” will reveal the next set of matching sequences.
- Example
- Here you are shown the name and order of each domain found in the architecture.
- Graphic
- A graphical representation of the example sequence. This shows all the domains that were found for that architecture and can be used like the domain graphics for the query. The black line(s) along the bottom of the image indicate where your query aligned to the target sequence. Hovering over the black line will reveal a pop-up with the alignment coordinates of the hit.
- View Scores
- Clicking this link will take you back to the score view and restrict the results shown to only those that have the selected architecture.
Refining Searches
Searches can be refined by either selecting hits matching a specific domain architecture, a taxonomic level, or both.
Refine by domain architecture
Click on the “Domain” tab to see all hits clustered by the domain architecuture they match. To drill down into a specific architecture click on “view scores”. The resulting page shows all sequence hits matching the domain architecture and there is a box telling you that your results have been filtered.
Refine by taxonomic level
Click on the “Taxonomy” tab to see all hits organised according to a species. To show sequences from a given taxonomic level only, click on an internal or leaf node of the species tree which updates the species in the lower part of the page. Click on “Show” to show all sequences for the corresponding species. If you have clicked on an internal node, then you will find an additional button “Show scores for all” at the bottom of the page. The resulting page shows all sequence hits matching the taxonomic level and there is a box telling you that your results have been filtered.